Governing equations
In this work, multiphaseInterFoam, the multi-phase solver of OpenFOAM, is used to simulate the flow composed of three immiscible phases (i.e., water, slide, and air). The governing equations are the incompressible Navier-Stokes equations with spatially varying density and viscosity and a VOF method to track the interfaces40.
The phase-fraction of phase i is first defined as follows:
$$_(x,t)=\left\{\begin 1&{{{\rm{if}}}}\,{{{\rm{phase}}}}\,i\,{{{\rm{is}}}}\,{{{\rm{present}}}}\,{{{\rm{at}}}}\,x,t\\ 0&else.\end{array}\right.$$
(1)
The continuity and momentum equations respectively read:
$$\nabla \cdot {{{\bf{u}}}}=0,$$
(2)
$$\frac{\partial \rho {{{\bf{u}}}}}{\partial t}+\nabla \cdot (\rho {{{\bf{u}}}}{{{\bf{u}}}})=-\nabla p+\nabla \cdot (2(\mu +{\mu }_{t}){{{\bf{D}}}})+\rho {{{\bf{g}}}}+{f}_{\sigma i}.$$
(3)
with u the fluid local velocity, g the gravitational acceleration, p(x, t) the pressure field, ρ(x, t), μ(x, t) and μt the local fluid density, molecular dynamic viscosity and eddy viscosity, respectively. \({{{\bf{D}}}}=\frac{1}{2}(\nabla {{{\bf{u}}}}+{(\nabla {{{\bf{u}}}})}^{T})\) is the strain rate tensor, while fσi = σ κ ∇ αi is the surface tension force, modeled as a continuum surface force41, in which σ is the surface tension at the interface and κ the local curvature of the interface.
In most of the cells, there is only one phase present. In this case, the density and viscosity affected to the cell corresponds to this phase. When the cell is crossed by one interface, the local mixture properties are computed by averaging among the existing phases. Therefore, in the whole domain, the local density and viscosity can be calculated following:
$$\rho (x,t)=\sum\limits_{i=1}^{N}{\alpha }_{i}(x,t)\,{\rho }_{i},$$
(4)
$$\mu (x,t)=\sum\limits_{i=1}^{N}{\alpha }_{i}(x,t)\,{\mu }_{i}$$
(5)
with N the number of phases, while ρi and μi are density and molecular dynamic viscosity of the ith phase.
The phase fraction value is updated at each time step thanks to the phase fraction advection equation given by:
$$\frac{\partial {\alpha }_{i}}{\partial t}+\nabla \cdot \left({\alpha }_{i}{{{\bf{u}}}}\right)+\nabla \cdot \left({\alpha }_{i}\sum\limits_{j=1,\,j\ne i}^{N}{\alpha }_{j}\,{u}_{r,ij}\right)=0\,.$$
(6)
Here ur,ij is the relative velocity between phases. The last term is employed as a numerical technique to ensure a sharp and non-diffusive interface42. The phase volume fractions equation (Eq. (6)) is solved with the MULES (Multidimensional Universal Limited Explicit Solver) algorithm to ensure the conservation of sharp interfaces between a pair of phases43.
The time and space computational domains are discretized into a finite number of time steps and cells to solve the governing equations. Spatial discretization is the standard Gaussian finite-volume integration method based on summing values on cell faces, which must be interpolated from cell centers44.
Equations (2) and (3) are solved with the PIMPLE algorithm which takes care of the pressure-velocity coupling. The CFLconv condition ensures the stability of the solution with respect to the convective terms of equation (3), by limiting the time step Δt as follows:
$$CF{L}_{conv}=\frac{| {{{\bf{u}}}}| \,\Delta t}{\Delta x} < 1$$
(7)
It is also important to respect a condition on the diffusive terms of equation (3) expressed as45:
$$CF{L}_{diff}=\frac{(\mu +{\mu }_{t})\,\Delta t}{\rho \,\Delta {x}^{2}} < 1$$
(8)
In the simulations performed here, we impose a strong limit on the convective CFL (CFLconv < 0.1) which is sufficient to indirectly respect equation (8).
The turbulence model used in the current study is a k-ω SST buoyancy-modified turbulence model46. This model limits the spurious production of turbulent kinetic energy k usually observed with classical RANS models at the interfaces thanks to the new buoyancy term (Gb) added in the equation (see also the recent developments of refs. 47,48 on this topic).
The governing equations for the turbulent kinetic energy k and the turbulent energy dissipation frequency ω read:
$$\frac{\partial \rho \,k}{\partial t}+\nabla \cdot (\rho \,k\,{{{\bf{u}}}})=\nabla \cdot \left(\left(\mu +{\sigma }_{k}\,{\mu }_{t}\right)\,\nabla k\right)+{P}_{k}-\rho \,{\beta }^{* }\omega k+{G}_{b},$$
(9)
$$ \frac{\partial \rho \,\omega }{\partial t}+\nabla \cdot (\rho \,\omega \,{{{\bf{u}}}})=\nabla \cdot \left(\left(\mu +{\sigma }_{\omega }\,{\mu }_{t}\right)\,\nabla \omega \right)+\frac{\gamma }{{\nu }_{t}}\cdot \\ G-\rho \beta {\omega }^{2}+2\rho (1-{F}_{1})\cdot \frac{{\sigma }_{\omega 2}}{\omega }\cdot \nabla k\cdot \nabla \omega .$$
(10)
with: \(G=\rho {\nu }_{t}| \dot{\gamma }{| }^{2}\), Pk = min(G, 10ρβ* kω), \({\nu }_{t}=\frac{{a}_{1}k}{max({a}_{1}\,\omega ,\sqrt{2}\,\dot{\gamma }\,{F}_{2})}\,\).
β* and a1 are equal to 0.09 and 0.31, respectively. F1 and F2 are blending functions (ϕ = F1ϕ1 + (1 − F1)ϕ2) which causes the model to behave as a k-ω model in the vicinity of the boundaries and as a k-ϵ model in the rest of the domain.
Model setup
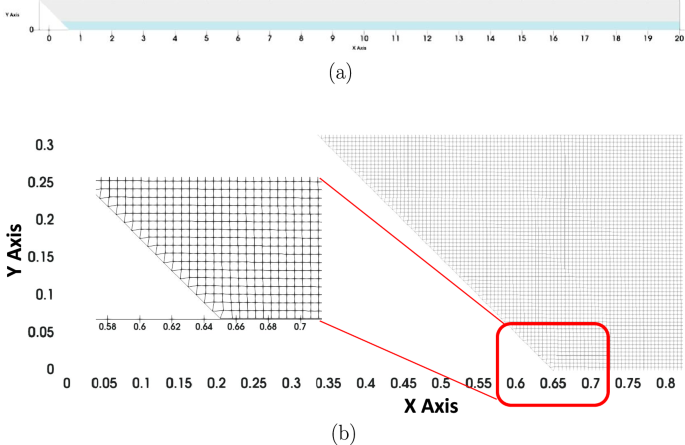
In the study conducted in this article, the computational domain is a two-dimensional prismatic tank, 20.3 m long and 1 m high (Fig. 7a). A 45° inclined plane, on the left side of the domain, drives the slide motion for the wave generation.
The simulations are carried out with “multiphaseInterfoam” considering three phases (i.e., slide, water, and air). Each phase is initially located in the domain thanks to an individual phase fraction (e.g., “alpha.water” for water phase). In the basin, the water elevation (h0) is constant and equal to 20 cm. The slide phase is placed over the slope and its characteristics (volume V0 and initial height hs) vary depending on the case. The empty space left by the two other phases is filled with air.
A uniform mesh is employed to avoid non-orthogonality and skewness of the mesh cells, which are both known to challenge most VOF algorithms. Taking into account the conclusions of the validation study and according to the wave features expected in our numerical experiment (observed between 0.01 and 0.27 m), we selected two cell sizes: 2.5 mm and 5 mm, each with an aspect ratio of one. The smaller mesh size, 2.5 mm, is applied in cases involving the smallest waves to ensure that the mesh resolution adequately captures the wave amplitude. The mesh is generated, first with “blockMesh” and, then with “snappyHexMesh”. In total, It consists of a maximum of 1,251,120 hexahedral cells and 160 prism-shaped cells (Fig. 7b).
The walls, slope, and bottom boundary conditions are set to “noSlip” for the velocity field and zero-flux for the other fields. The top boundary is an open atmosphere boundary condition. The total duration of the simulation is set to 12 s. This is considered to be a sufficient duration to cover the full wave propagation through the tank in the majority of cases. The data output is carried out every 0.05 s. Other numerical methods and parameters, such as the turbulence model for instance, are chosen based on published recommendations28. Table 1 summarizes the final model setup retained.
Length of the channel
With 20.3 m, the length of the channel represents 100h0. In the interpretation of Fig. 4, it is assumed that the leading wave had reached the so-called “far field” zone at the end of the channel, which means that the main wave transformation processes have ceased. The examination of the turbulent dissipation rate ϵ allows to track the end of the breaking phase which, in our case, arises within the computation domain for all the cases (except the largest volume for which, there is still a slight dissipation remaining at the end of the domain as also witnessed by the value of the relative wave amplitude in Fig. 4b). On the other hand, dispersion affects the wave continuously with variable intensity and therefore, there is no real end of this process unlike wave breaking. Therefore, the length of the channel should account for most of the transformation. The evolution of the wave amplitude with the distance to generation has been measured in wave flumes16,18,49. Note that generally, the domain considered is shorter than in the present study (i.e., ≈ 50h0 or less). The attenuation is found dependent on the wave type which is consistent with the conclusions of the present work. The exponential attenuation coefficient reported in the literature are for instance16,49, a = −0.4 for weakly nonlinear oscillatory waves and b = − 0.05 for nonlinear or the solitary waves, or an average value (including all wave type) of c = − 0.25. This gives an amplitude attenuation of 85%, 20% and 70% over the current computational domain for a, b and c, respectively. Over a domain of double extent (i.e., 200h0), the corresponding attenuation would be respectively 88%, 24% and 74%. Consequently, as wave transformation is expected to be much slower beyond the domain limit, the computational domain extent appears sufficient to account for the quickest and most significant dispersion effects and the energy transfer efficiency results presented in Fig. 4 can be considered as relevant values.
Computation of energy and dissipation in each phases at time t
At each time step, the mechanical energy Em of each phase m is the sum of the potential energy Ep,m and the kinetic energy Ek,m. The global kinetic energy of phase m is the sum of the mean flow kinetic energy and the turbulent kinetic energy within this phase:
$${E}_{k,m}(t)={\iint }_{A}{\alpha }_{m}(t)\,(\frac{1}{2}\,{\left\vert {{{\bf{u}}}}({{{\bf{t}}}})\right\vert }^{2}\,+k(t)){\rho }_{m}\,dx\,dy$$
(11)
with A denoting the computational area.
The potential energy of phase m is:
$${E}_{p,m}(t)={\iint }_{A}{\alpha }_{m}(t)\,g\,y(t)\,{\rho }_{m}\,dx\,dy$$
(12)
with y, the vertical coordinates of the point with respect to the water surface at rest.
The amount of energy dissipated at time t1 is the integration in time of the energy dissipation rate Φ(t).
$${E}_{diss,m}({t}_{1})= \int_{0}^{{t}_{1}}\Phi (t)dt=\int_{0}^{{t}_{1}}{\iint }_{A}({\alpha }_{m}(t)\,{\mu }_{m}\,\dot{\gamma }(t)\dot{\gamma }(t)\,dx\,dy \\ +{\alpha }_{m}(t)\,\epsilon (t)\,{\rho }_{m}\,dx\,dy)\,dt,$$
(13)
where \(\dot{\gamma }(t)\) denotes the scalar shear rate value in the cell. This dissipation is the sum of two components: the laminar dissipation and the turbulent dissipation.
For the energy components of the wave train, the integration in the horizontal direction starts from the slide tip25. The potential energy of the wave field is therefore obtained by:
$${E}_{p,wave}(t)= {\iint }_{{x}_{slide-tip}}^{{x}_{end-channel}}{\alpha }_{w}(t)\,{\rho }_{w}\,g\,y(t)\,\,dx\,dy \\ -\int_{0}^{{h}_{0}}\int_{{x}_{slide-tip}}^{{x}_{end-channel}}\,{\rho }_{w}\,g\,y(t)\,\,dx\,dy,$$
(14)
The leading wave energy components are obtained by isolating the area concerned with a zero crossing method.
Model validation
As previously mentioned, a thorough validation of the multiphase solvers of OpenFOAM (i.e., interFoam and multiphaseInterFoam) has been previously published28. In this paper, the phenomenon (i.e., impulse waves generated by fluid-like subaerial slides) was divided into elementary process, for which, a dedicated validation was, each time, performed. The following processes were studied: slide flow, wave generation and breaking, wave dispersion, energy conservation in a propagating wave, energy conservation in a breaking wave and dissipation in the turbulent bore. Table 2 displays all the cases with the reference set-up and the required number of cells, in the slide thickness or the wave height, depending on the case, to accurately resolve the case.
The originality of this validation work stands in the consideration of energy conservation or dissipation calculation. This aspect is rarely addressed in previous validation works, while it is crucial when the energy transfer from slide to wave is to be computed. It is shown that the breaking wave energy is acceptably conserved with the buoyancy modified k − ω SST turbulence model46 but not with other more usual models such as the k − ϵ or the k − ω SST models. Additionally, the turbulent bore physical dissipation computed by the model was shown to tend to the analytical solution when decreasing the cell size. The minimum number of cells required to achieve these results are indicated in Table 2. The meshes used in the present paper have been chosen to respect these constraints on the number of cells.
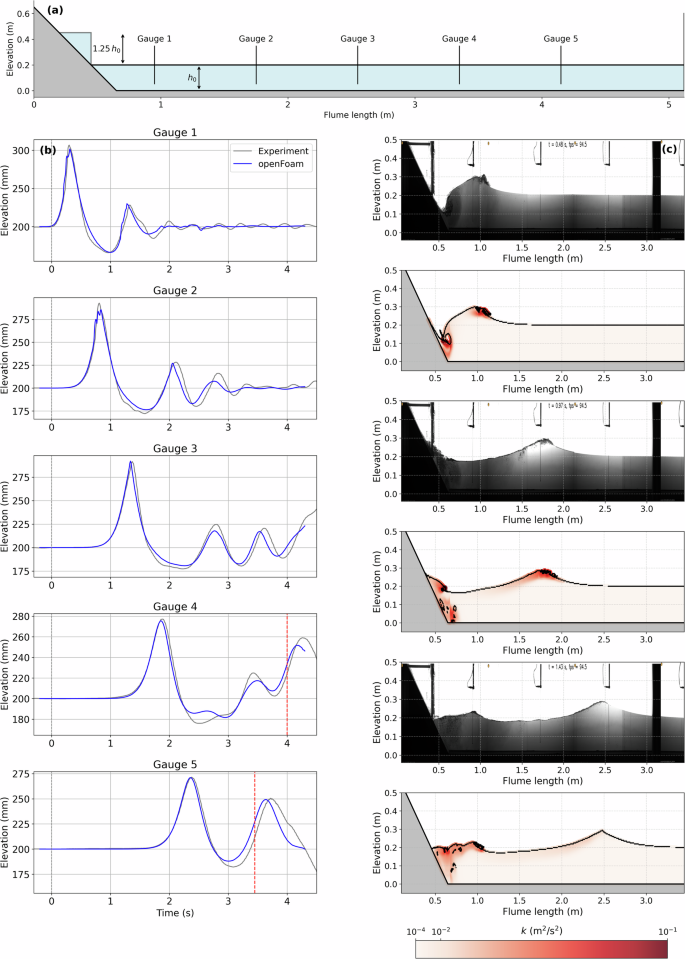
In order to demonstrate the validity of the model in the configuration studied in the present work, an experiment has been specifically conducted. The flume is 5.12 m long, 0.25 m wide and 0.65 m high (Fig. 8a). A pneumatically driven gate, positioned at x = 0.45 m, is used to release a water volume of triangular shape over a 45° slope as in the simulations presented in this article. The case considered for the experiment correspond to the optimum surface of Fig. 4 which features a slide height hs = 1.25h0 and no initial elevation (hl = 0). The downstream depth h0 is equal to 20 cm as in the simulations. Five wave gauges (HRWG-0105, HR Wallingford) were used to record the instantaneous water surface at an acquisition frequency of 100 Hz at different positions along the flume (Fig. 8a). Additionally, five cameras (Basler acA2000-165um) allowed to control the occurrence of wave breaking through the presence of foam in the movies as well as to capture the motion law of the lifting gate. The measurements were compared to a simulation performed with a model similar to the one presented in the results section, namely same numerical parameters and mesh resolution. The only differences are the domain considered (i.e., flume length of 5.12 m instead of 20 m) and the modeling of the gate motion28. The latter is mandatory to accurately reproduce dam break flows over wet bottom as reported in earlier comparable studies28,50. Finally, the experiment was conducted five times to check the repeatability. The wave gauge signals obtained were almost undistinguishable, therefore, in this section, only one run is presented.
a sketch of the experimental flume and gauge locations. b temporal evolution of the water surface at the five gauge positions and corresponding simulation results (the dotted red lines mark the times when the signal is affected by the wave reflection on the downstream boundary). c comparison of the camera and model snapshots for different wave breaking stages.
Figure 8b, c shows the comparison between the experiment and the simulation. Panels of column (b) allows to verify the model ability to generate the main wave accurately and compute its subsequent evolution in time, including the birth of the dispersive trail. In particular, the evolution of the leading wave amplitude and wavelength appears very similar to the data. The agreement is slightly less satisfactory for the leading wave back face and the amplitude of the trailing waves. Nevertheless, the numbers of trailing waves as well as their time evolution are overall respected. One important feature of this model is its expected capacity to reproduce the dissipation by breaking28. The panels of column (c) shows the good behavior of the model regarding this aspect. The different phases of the process are indeed respected with, in the first two panels (starting from the top position), the breaking inception as a plunging breaker, in the two middle panels, the evolution toward a milder breaking in the data as in the simulation and finally, in the two bottom panels, the cease of the breaking at the same time and same position. The correct description of the breaking is obviously mandatory to get a good correspondence in amplitude as observed in the column (b).
Granular slide model
In Section “Influence of rheology and submergence”, granular slides are simulated to compare their efficiency to the reference water slide case. The rheological model used is a non-Newtonian Coulomb viscoplastic model51. This model has been first implemented in the solver interMixingFoam (OpenFOAM®) to study debris flow cases52 and later applied in multiPhaseInterFoam, to study waves generated by granular landslides53. Computation results were successfully compared with experimental data involving subaerial and submarine granular slides. For the computations carried out in Section “Influence of rheology and submergence”, the same approach has been followed. The model and its parameterization are described in the following.
The slide material is considered to behave as a macroscopic non Newtonian phase with the following viscosity law54:
$$\nu ={\nu }_{min}+sin(\delta )\frac{P}{| | D| | {\rho }_{b}}\times \left(1-ex{p}^{-{m}_{y}| | D| | }\right)$$
(15)
with νmin the minimal kinematic viscosity, ∣∣D∣∣, norm of the strain-rate tensor, ρb slide bulk density, my a numerical parameter with units of seconds. This equation describes the granular flow as a non Newtonian rheological law with a yield stress equal to \(P\sin \delta\). The parameter my is added to allow a smooth transition between yielded and unyielded areas of the flow52.
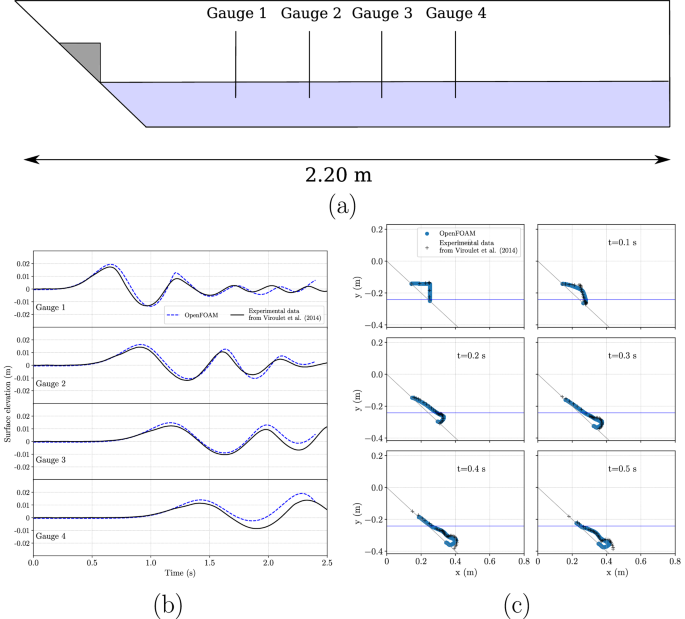
Figure 9 presents a validation of the model used in this study with respect to previous experimental data55. Based on the parameters of the experiment, the following parameters values have been used in the simulation: ρb = 1575 kg ⋅ m−3, δ = 23°, my = 0.2 s, νmin = 10−6 m2 ⋅ s−1. The figure shows the satisfactory match between data and simulation for the water free surface and the slide motion. The simulations presented in Section “Influence of rheology and submergence” used the same parameters as in this validation except case (d) which corresponds to the density of water.


